USD/JPY Faces Stiff Resistance
By Deya Hroob
 The trade set up is based on a daily chart.
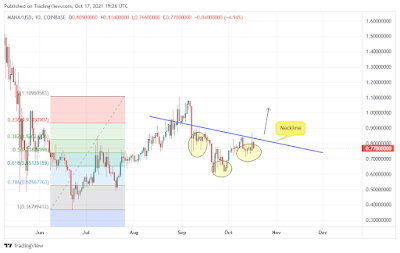
Last week, USD/JPY broke down the support level. And the pair found support near 106.00 level and bounced back to retest the broken structure.
As you can see from the chart above, there are many hurdles that makes hard for the pair to advance. The resistance line, moving averages and the trendline. As a result, the pair is more likely to visit lower levels.
The trade set up is :
Sell at 106.90 with first target 106.00 and stop loss 107.20
If the price breaks the resistance line, the trade will be invalided.
Good Luck,


Comments
Post a Comment