MANA/USDT, CHZ/USDT: Bullish Inverse Head and Shoulders Pattern
Bullish Inverse Head and Shoulders Pattern
MANA/USDT Daily Chart Analysis
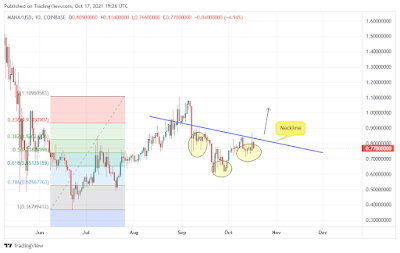
The pair is forming an Inverse Head and Shoulders Pattern.
How to Trade Inverse Head and Shoulders Pattern?
We have to wait the price to penetrate the neckline, and then go long ( Buying ).
In MANA/USDT , if the price can go above the neckline, the target will be $1.10.
CHZ/USDT Daily Chart Analysis
The same pattern is spotted on CHZ/USDT pair.

If bulls could take the price above the neckline, our target will be $0.44.
Trade Wise and Good Luck,


Comments
Post a Comment