XAU/USD Ascending Triangle in 1H Chart
By Deya Hroob

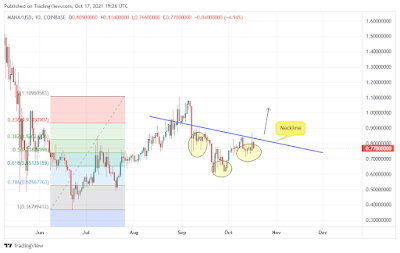
Gold is in strong bullish mood. It has formed an ascending triangle in 1h chart. $1980 is the resistance line of the triangle.
To buy gold, you should wait a breakout above the resistance line OR buy at the trendline with stop loss below the line.
If price breaks below the trend line, $1945 and $1900 will be the support.
Trade Wise and Good Luck,


Comments
Post a Comment