Ethereum Can Moves On Two Directions
By Deya Hroob

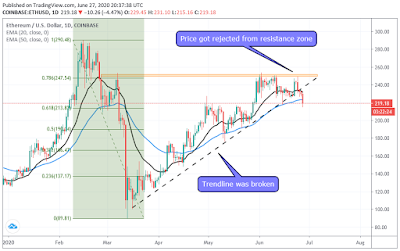
ETH/USD is currently trading on an uptrend line. The price finds support from the trend line and from moving averages . However, $250 level is proved to be the main hurdle for Ethereum, it triggered profit booking that dragged the price back to the trend line.
Now, we have to watch out the chart very closely since we should act as what market do, not what we like to do. Hence, there are two scenarios for the pair:
Bullish scenario : We can go long only if the price penetrates $250 level. We can trade the retest of the broken price. Our first target is $290.
Aggressive traders may trade when price touches the trend line with stop loss below the line.
Bearish scenario : Ethereum will be negative if the uptrend line breaks down. To confirm the break down, we need a daily closed candle below the trend line, after which we can trade the retest of the broken trend. The first target for sellers is $190.

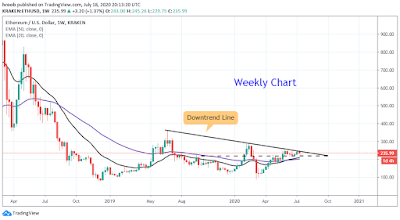
It's worth mention that the pair is trading near a major down trend line on weekly chart. And also the important level to watch according the this chart is $250 which goes in line with daily chart.
Good Luck!
Daily Chart
ETH/USD is currently trading on an uptrend line. The price finds support from the trend line and from moving averages . However, $250 level is proved to be the main hurdle for Ethereum, it triggered profit booking that dragged the price back to the trend line.
Now, we have to watch out the chart very closely since we should act as what market do, not what we like to do. Hence, there are two scenarios for the pair:
Bullish scenario : We can go long only if the price penetrates $250 level. We can trade the retest of the broken price. Our first target is $290.
Aggressive traders may trade when price touches the trend line with stop loss below the line.
Bearish scenario : Ethereum will be negative if the uptrend line breaks down. To confirm the break down, we need a daily closed candle below the trend line, after which we can trade the retest of the broken trend. The first target for sellers is $190.
Weekly Chart
It's worth mention that the pair is trading near a major down trend line on weekly chart. And also the important level to watch according the this chart is $250 which goes in line with daily chart.
Good Luck!


Comments
Post a Comment