Weekly Chart Prevents me to Buy Ethereum
By Deya Hroob
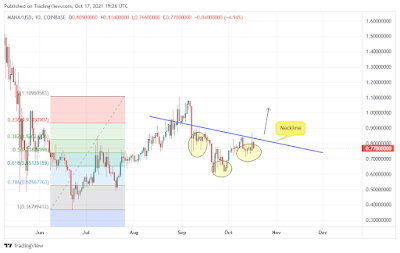
The trend line is still bearish on weekly chart. The price has been rejected many times from it. However, the positive thing is that ETH/USD is currently trading above the moving averages, which is a positive sign.
If the price turns down from the current levels, a fall to the support $216 is possible. On the other hand, if bulls manages to break up the downtrend line, a move to $288 level is likely, thereafter $360. Hence, long positions should be taken only on a breakout of the trend line.
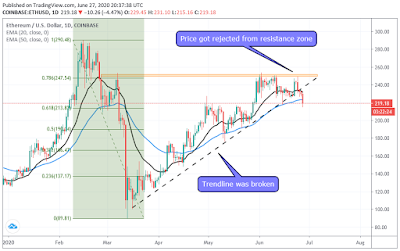
On daily chart, the price is trading in range $250 as resistance and $216 as support. This chart goes perfectly in line with weekly chart as $250 level coincides with downtrend line.
Wait the price to break up $250 level and go long. You can also buy on supports with using proper risk management.
Trade Wise and Good Luck,
Weekly Chart
 |
| Weekly Chart |
If the price turns down from the current levels, a fall to the support $216 is possible. On the other hand, if bulls manages to break up the downtrend line, a move to $288 level is likely, thereafter $360. Hence, long positions should be taken only on a breakout of the trend line.
Daily Chart
 |
| Daily Chart |
On daily chart, the price is trading in range $250 as resistance and $216 as support. This chart goes perfectly in line with weekly chart as $250 level coincides with downtrend line.
Wait the price to break up $250 level and go long. You can also buy on supports with using proper risk management.
Trade Wise and Good Luck,


Comments
Post a Comment