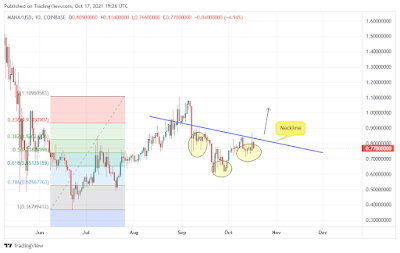
GBP/USD Technical Analysis: Inverted Head & Shoulders Pattern

This trade idea is based on daily chart.
GBP/USD has formed a well-known Inverted Head & Shoulders Pattern. Last Friday, the neckline (resistance) was broken. Usually, the price returns to the broken resistance. Hence, I will trade the retest.

For the targets I always search for Fibonacci Levels. I will use two different Fibonacci levels taken from different points. So the targets are 1.3080 , 1.3180
You should ignore this trade set up if the price breaks below the neckline.


Comments
Post a Comment