Ethereum Choose Bearish Scenario
By Deya Hroob

As I wrote before in the last analysis about ETH/USD that it can moves in two directions.
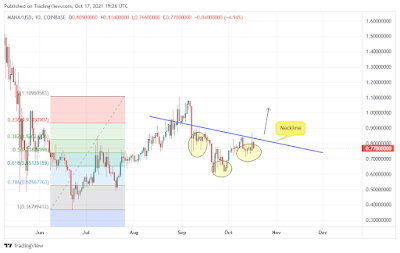
Yesterday, the pair broke down the trendline which is quite negative. Currently, it is trading around $220. There is a small support at $214 but if it is taken out the next support will be at $190.
The broken line becomes resistance now.

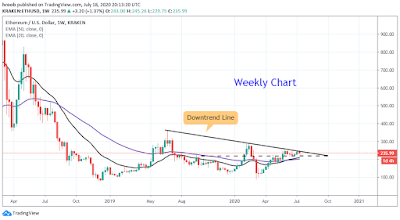
It's very important to know that the weekly chart of Ethereum is still bearish. And it will be bearish as long as the pair is trading below the downtrend line.
Trade Wise and Good Luck,

As I wrote before in the last analysis about ETH/USD that it can moves in two directions.
Yesterday, the pair broke down the trendline which is quite negative. Currently, it is trading around $220. There is a small support at $214 but if it is taken out the next support will be at $190.
The broken line becomes resistance now.

It's very important to know that the weekly chart of Ethereum is still bearish. And it will be bearish as long as the pair is trading below the downtrend line.
Trade Wise and Good Luck,


Comments
Post a Comment