EUR/GBP: Head and Shoulders Pattern Daily Chart
By Deya Hroob
This trade set up is based on daily chart.
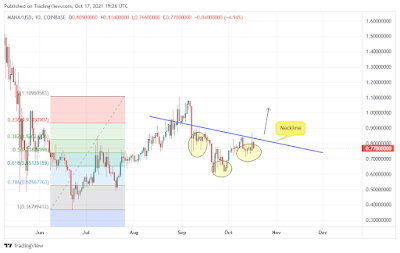
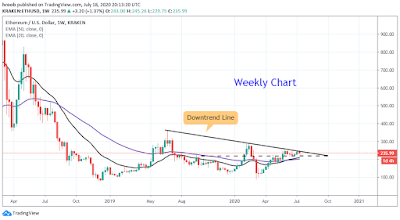
A well-known H&S pattern has been spotted on EUR/GBP daily chart. It's a bearish pattern. Also, the pair is trading under the moving averages.
You should wait a breakout of the neckline, and trade the retest of the broken line. The neckline goes in line with the 0.236 Fibonacci levels at 0.8864.
I used Fibonacci levels to find my targets. The targets are 0.8774 and 0.8665
I have provided two different Fibonacci levels charts.
We should neglect the pattern, if the price goes above the moving averages.


Comments
Post a Comment