USD/CAD is Struggling Between Moving Averages
By Deya Hroob

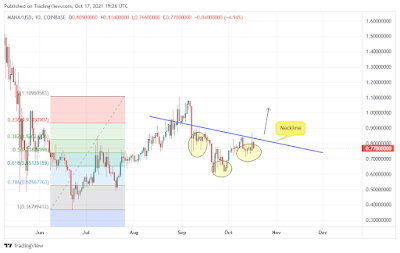
This trade set up is based on daily chart.
USD/CAD is currently trading between 20-day EMA as support and 50-day EMA as resistance. The 20-day EMA is at the same level as 0.236 Fibonacci retracement which gives this support an importance.
I will wait the price to go above the 50-day EMA to go long with target 1.3830.
1.3830 is a level where I expect sellers will defend their positions strongly. So, for now I am looking for long position. For short position I will wait to see if the pair manages to reach 1.3830 then I may look for sell opportunity.
Trade Wise and Good Luck!


Comments
Post a Comment