GBPUSD is Trading Near Resistance Areas
By Deya Hroob
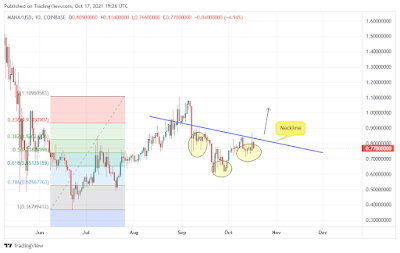
GBP/USD Daily Chart

GBP/USD is approaching resistance areas. The trendline and the resistance structure.
In order to open long position, I need to wait the price to break above these resistance. If this happens my target will be : 1.4050 , 1.4120
However, if the price turns down from the resistance , the pair may fall again to 1.38 level again.
Trade Wise and Good Luck,


Comments
Post a Comment