US/OIL: Reasons Behind the Steady Rise

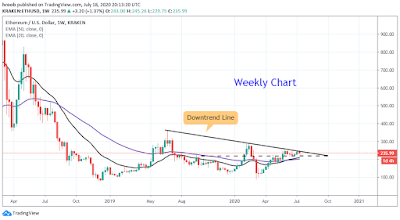
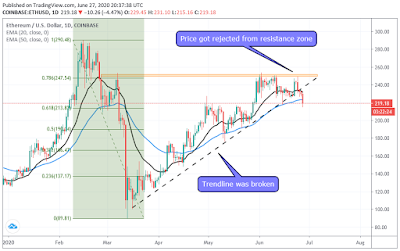
WTI has risen more than 6% in the past two days. Nevertheless, the main trend is bearish according to weekly and daily chart.
The main resistance now is 200-day EMA ( daily chart ). For 1h chart, a golden cross is about to complete which is positive.
If the bulls could take the price above the 200-day EMA, a move to $43.70 is expected.

The reasons behind the recent spike according to FXStreet News Portal are.....
The latest API data showed a heavy decline in oil inventories.
Moreover, Hurricane Sally’s expected landfall on the US Gulf Coast had led to more than a quarter of US offshore oil and gas production shuttering as well as key exporting ports.
The unpredictability about oil production in the Gulf was bullish for oil prices.
Trade Wise and Good Luck,


Comments
Post a Comment