NZD/USD is Trading In Descending Triangle
By Deya Hroob


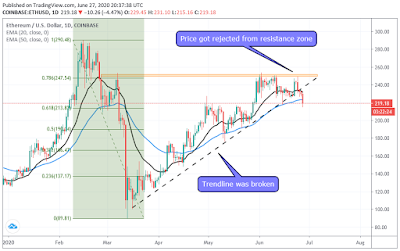
Our bearish target will be close at 0.6320 since three support structures meet there the 200-day EMA , 0.236 Fibonacci level and finally the support line.
Trade Wise and Good Luck!
This trade set up is based on 4h chart.
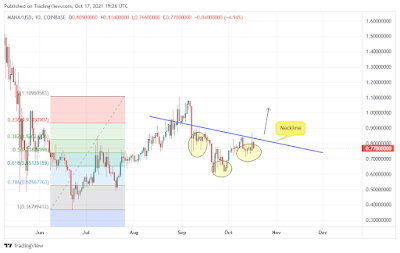
NZD/USD is clearly forming a descending triangle. Although this type of pattern is considered as a continuation pattern, ( It means price will continue in the trend direction it was moving before the pattern appeared) but who knows. It may go in two directions.
All what we should do is wait the direction of the breakout and trade this breakout.
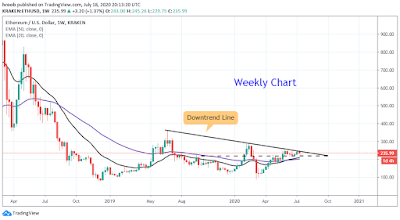
To spot our targets profits, we should look at daily chart
Our bullish target will be 0.6580 the previous daily high.
Our bearish target will be close at 0.6320 since three support structures meet there the 200-day EMA , 0.236 Fibonacci level and finally the support line.
Trade Wise and Good Luck!


Comments
Post a Comment