EUR/GBP is Trading between Fibonacci Levels
By Deya Hroob

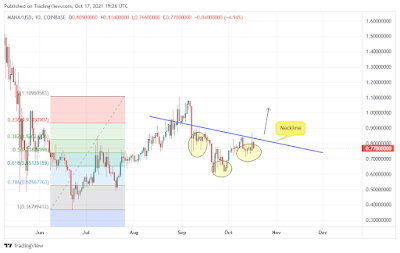
This trade set up is based on daily chart.
0.8865 (which is also 0.236 Fibonacci level) is proved to be a strong support, that's why it's one of our buying areas.
As the pair is trading near a resistance level, I don't recommend open long position now.
We may buy in two conditions:
Firstly, when the price revisits the support line, with stop loss below that line.
Secondly, when the pair breaks out the resistance level ( What I mean here a breakout is a daily closed candle above this level).
Good luck!
This trade set up is based on daily chart.
EUR/GBP is currently trading within two Fibonacci levels as shown on the chart above.
0.8865 (which is also 0.236 Fibonacci level) is proved to be a strong support, that's why it's one of our buying areas.
As the pair is trading near a resistance level, I don't recommend open long position now.
We may buy in two conditions:
Firstly, when the price revisits the support line, with stop loss below that line.
Secondly, when the pair breaks out the resistance level ( What I mean here a breakout is a daily closed candle above this level).
Good luck!


Comments
Post a Comment