AUDUSD: Multi Time Frame Analysis & Trading Plan
By VasilyTrader

The price is recovering after a drop from 0.656 but we are still looking for a short opportunity.
At the moment I am looking at price action on 1H chart:
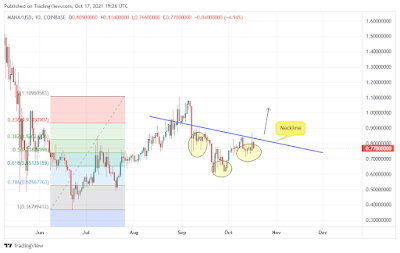
the pair is currently forming the right shoulder of a head & shoulders pattern.
Being formed, our call to action is the neckline breakout (1H candle close).
We short the market on a pullback and aim at: 0.638 / 0.633 levels.
In such trades, stop is always adjusted to the right shoulder and strictly set above that.
so if the right shoulder will be formed from a higher level, make the adjustment.
In case of a bullish continuation and violation of the head level setup will be invalid.
Good luck!

AUDUSD is stranding on a key daily level 0.645.
The price is recovering after a drop from 0.656 but we are still looking for a short opportunity.
At the moment I am looking at price action on 1H chart:
the pair is currently forming the right shoulder of a head & shoulders pattern.
Being formed, our call to action is the neckline breakout (1H candle close).
We short the market on a pullback and aim at: 0.638 / 0.633 levels.
In such trades, stop is always adjusted to the right shoulder and strictly set above that.
so if the right shoulder will be formed from a higher level, make the adjustment.
In case of a bullish continuation and violation of the head level setup will be invalid.
Good luck!


Comments
Post a Comment