US Dollar Trading Plan: EUR/USD, USD/JPY, GBP/USD
By Deya Hroob

EUR/USD is trading under resistance from 200 moving averages and resistance line.
To open long we need to undertake these resistance.
Open long position on a close candle above 109.70
First target 110.40, then 111.45
On the downside, 109.20 level is the first support. We can also buy at this level unless it's broken. ( remember our trading set up depends on closing candles, you have to wait until candles close. Don't rush in trades :)
Our buying set up will be invalided if the pair breaks 109.20 level.

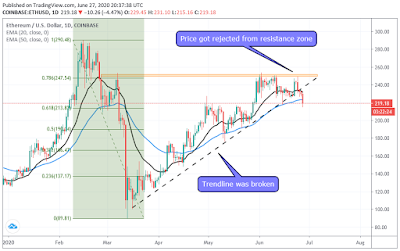
Our last recommendation on USD/JPY is still valid.
After the breakout, the price has retested the broken support ( which now becomes resistance) numerous times .
Trading the retest of key levels in the market can be an extremely simple yet powerfully effective trading strategy.

In case of a breakout the upper line, the first target will be at 1.2565
Good luck!
All trading set up are based on 4h charts!
EUR/USD is Trading Between Moving Averages.
EUR/USD is trading under resistance from 200 moving averages and resistance line.
To open long we need to undertake these resistance.
Open long position on a close candle above 109.70
First target 110.40, then 111.45
On the downside, 109.20 level is the first support. We can also buy at this level unless it's broken. ( remember our trading set up depends on closing candles, you have to wait until candles close. Don't rush in trades :)
Our buying set up will be invalided if the pair breaks 109.20 level.
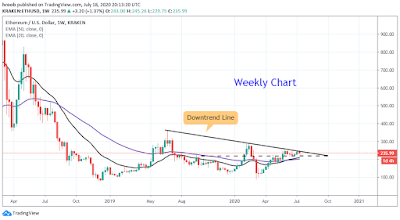
USD/JPY Broke out The Triangle Pattern
Our last recommendation on USD/JPY is still valid.
After the breakout, the price has retested the broken support ( which now becomes resistance) numerous times .
Trading the retest of key levels in the market can be an extremely simple yet powerfully effective trading strategy.
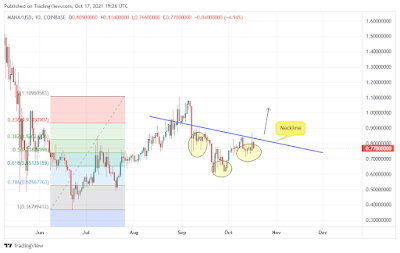
GBP/USD is Trading at Resistance Level
The pair is forming a bull flag pattern. The simplest way to trade the pattern is to wait for the breakout and trade that breakout so Be patient :) Our Previous Trade Set up On GBP/USD
In case of a breakout the upper line, the first target will be at 1.2565
Good luck!


Comments
Post a Comment