Posts

Showing posts from July, 2020

EUR/JPY Potential Cup with Handle Pattern

Image
By Deya Hroob This trade set up is based on 4h chart Thers is a potential Cup with Handle Pattern on EUR/JPY 4h chart. It's a continuation pattern that makes a consolidation period before followed by a breakout.  Currently, we have a cup and the handle but we need a breakout of the handle resistance line to confirm the pattern. How to Trade Cup with Handle Pattern? Wait the breakout to happen and open long on a retest of the broken line. On the other hand, if the price breaks below the the support line of the handle, the pattern is invalided. Trade Wise and Good Luck!

GBP/CAD Potential Inverted Head and Shoulders

Image
By Deya Hroob GBP/CAD Inverted Head and Shoulders ( daily chart ) The pair is forming an Inverted Head and Shoulders Pattern. In order to confirm the pattern, we just need a breakout of the neckline. If this happens, I will try to trade the retest of the neckline. To spot my targets, I will use Fibonacci Levels. The first target will be 1.73. If the price turns down from neckline, the pattern will be invalidated. Trade Wise and Good Luck,

Weekly Chart Prevents me to Buy Ethereum

Image
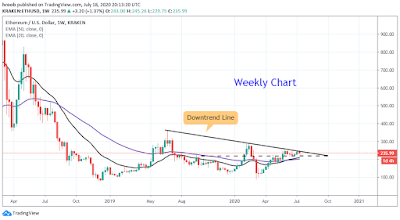
By Deya Hroob Weekly Chart Weekly Chart The trend line is still bearish on weekly chart. The price has been rejected many times from it. However, the positive thing is that ETH/USD is currently trading above the moving averages, which is a positive sign.  If the price turns down from the current levels, a fall to the support $216 is possible. On the other hand, if bulls manages to break up the downtrend line, a move to $288 level is likely, thereafter $360. Hence, long positions should be taken only on a breakout of the trend line. Daily Chart Daily Chart On daily chart, the price is trading in range $250 as resistance and $216 as support. This chart goes perfectly in line with weekly chart as $250 level coincides with downtrend line. Wait the price to break up $250 level and go long. You can also buy on supports with using proper risk management.  Trade Wise and Good Luck,

EURUSD: Price Action & Scenario for Next Week

Image
By VasilyTrader EURUSD is trading within a rising parallel channel on 4H. the resistance of the channel was reached on Wednesday and the market set it's last higher high there. during the next two days the pair started to consolidate: with a sequence of three equal highs and two equal lows, the price is stuck in a narrow horizontal trading range. next week, with a high probability the price will retrace one more time from the horizontal resistance. then sellers will face with a buying pressure from a channel's and range's supports. consider this range for potential quick trades next week. to catch the next wave, I would suggest waiting for a violation of the range. we can not estimate how long the market will trade there, so it would be better to just wait. Good Luck,

USOIL is forming an Ascending Triangle

Image
 By Deya Hroob I am carefully watching Oil these days as it may offer us some profitable trades. On the daily chart, Oil has formed an ascending triangle. It's considered as a continuation pattern. However, this is not always the case. We should follow the market. How to Trade Ascending Triangle? We should wait a breakout to happen. Aggressive traders can place buying order above the resistance line OR selling order below the slope of the higher lows. Personally, I prefer trading retests when breakouts happen. Once a breakout occurs, I wait for a pullback to the broken line and open my position. Trade Wise and Good Luck,

Watch out a Breakout on USOIL

Image
By Deya Hroob OPEC+ is right now leaning towards allowing the production cuts to drop from 9.7 mb/d to 7.7 mb/d beginning in August. The group’s technical committee meets this week.   The challenge for the group is that while they don’t want to cede market share to other producers bringing production back, if they ease the cuts they risk pushing oil prices down. Technically,   The price has been capped between 200-day EMA as resistance and 20-day EMA as support for the last two weeks. You can see clearly how the price has respected these two lines lately.   However, we are very close to a breakout to happen. A breakout of the 200-day EMA will signal strength and is likely to attract further buying, resulting in a move to 43.50. Trade Wise and Good Luck!

EURGBP Is Trading above 0.9000 Level

Image
By Deya Hroob After falling to 0.8937 level last week, the pair rose back above 0.9000 level. The reason behind this is the European Central Bank meeting on Thursday but also the setup of the recovery fund ahead of the meeting between European leaders in Brussels on Friday. Technically, The pair is breaking up the falling wedge in 4h chart and trading above the moving averages which is a bullish sign. However, it's trading near resistance structure as shown in the chart. In the flip side, 0.9000 level and the moving averages will be the support. Trade Wise and Good Luck,

Inverted Head and Shoulders in GBP/CHF

Image
By Deya Hroob  This trade set up is based on 4h chart. I will wait a retest to the neckline to go long with stop loss under the 50 EMA. The moving averages will act now as support levels. If I get a closed candle below the neckline , the pattern will be invalided. Trade Wise and Good Luck,

EUR/CHF is Trading in Falling Wedge

Image
By Deya Hroob This trade set up is based on 4h chart As you can see from the chart, the pair is trading in falling wedge. The best way to trade such pattern is to wait a breakout in either directions. Aggressive traders can also trade between upper and lower lines provided that they use proper risk management. Trade Wise and Good Luck,

USD/CAD Update Daily Chart

Image
By Deya Hroob Watch out this pair very carefully as it's trading now near the downtrend line. This line proved to be stiff resistance. The pair is more likely revisit the support structure as long as it is below the downtrend line. Today,the price has rebounded from 1.35 support. However, it's still trading below major moving averages. If it manages to break up the line, 50-day EMA will be the next resistance. In the flip side, any fall to the support structure will be a good opportunity for buyers to jump in. As always, use proper risk management on all your trades. Trade Wise and Good Luck,

Gold Heading to Multi-years High

Image
By Deya Hroob Gold surpassing the 1800 mark for the first time since November 2011 heading to multi-years high at $1920 from September 2011. After breaking out the upper line of the rising wedge, XAU/USD resumes it bullish direction. Levels to watch out now $1825 then $1850. If Gold closes above $1804 on daily candle, we will more likely see more gains. Trade Wise and Good Luck,

Gold is Trading in an Ascending Triangle

Image
By Deya Hroob XAU/USD is trading in an ascending triangle. Although this kind of pattern is considered as a continuation pattern and although Gold is bullish but no one knows. You should not be obsessed with which direction the price goes, but you should be ready for movement in either directions. As shown on the chart, it's a matter of time that Gold should decide on what direction it will take. If we want to trade it safe, we shouldn't take any trades until a breakout happens. Until then just keep an eye on it. Trade Wise and Good Luck,

USDCAD May Continue It's Bearish Move

Image
By Deya Hroob  USDCAD is trading below the moving averages and the downtrend line. It got rejected from the downtrend line last week which suggests that the bears are selling at such levels. A retest of the support level will be on the cards if USDCAD can't handle these resistance. I think this level will be a good place to buy. On the flip side, my bearish view will be invalidated if the pair breaks out the downtrend line.If this scenario happens a move to 1.3840 level is possible and will be my target. Trade Wise and Good Luck,

GOLD (XAUUSD) Everything You Need to Know

Image
By VasilyTrader   To trade wisely gold next week here are the main points to consider. higher time frame perspective (daily/weekly): - market is in a strong bullish trend - market is approaching a weekly resistance - 1779 - 1802 is a strong weekly resistance cluster - 1738 - 1749 is a strong daily support cluster lower time frame perspective (4H): - market is in a strong bullish trend - market is stuck in a horizontal accumulation area 1760 - 1786 Though long positions remain our priority, we should be careful with a price action around a weekly structure. analyzing 2011-2012 perspective the price can easily start a strong bearish rally soon. with high probability current structure high will be retested this week. look for a reaction of the market and short only after a strong confirmation. same thing with long trades, take longs from a support of the 4H range with a decent confirmation, or from a daily support cluster. No rush, it is very easy to be stopp

USOIL is Trading Near Resistance!

Image
By Deya Hroob This trade set up is based on daily chart. USOIL has been trading in uptrend for two months. If you look at the chart, you can see clearly that 20-day EMA has proved to be a good support OIL. The price has rebounded from it many times before. On the contrary, 200-day EMA is the big resistance now, USOIL has to handle this resistance in order to see further gains. A breakout of the 200-day EMA will signal strength and is likely to attract further buying, resulting in a move to 43.50. However, if Oil turns down from the resistance, a drop to the 20-day EMA and the uptrend Line is expected. Trade Wise and Good Luck!